Model database fetching and inference#
Here, we’ll show how to retrieve different types of models from CREsted’s model repository: peak regression models (DeepBICCN and DeepMouseBrain3) and track models (Borzoi Prime).
Load model & set up genome#
from pathlib import Path
import numpy as np
import keras
import crested
import matplotlib.pyplot as plt
# Set the genome
genome = crested.Genome("mm10/genome.fa", "mm10/genome.chrom.sizes")
crested.register_genome(genome)
2026-02-16T14:48:20.230621+0100 INFO Genome genome registered.
model_path, output_names_biccn = crested.get_model("DeepBICCN")
model_biccn = crested.utils.load_model(model_path)
Region predictions and contribution scores#
chrom, start, end = "chr3", 72535878, 72536378
midpoint = (start+end)//2
start_resized, end_resized = midpoint - 2114//2, midpoint + 2114//2
sequence = genome.fetch(chrom, start_resized, end_resized)

prediction = crested.tl.predict(sequence, model_biccn)
2026-02-16T14:48:25.812594+0100 INFO Lazily importing module crested.tl. This could take a second...
1/1 ━━━━━━━━━━━━━━━━━━━━ 11s 11s/step
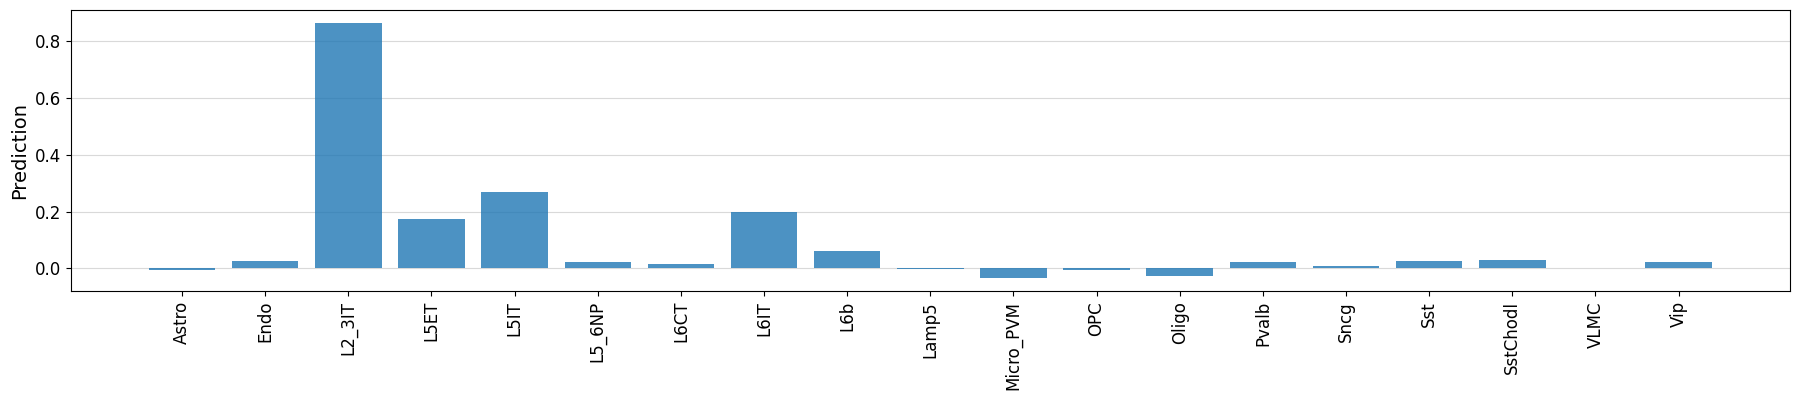
%matplotlib inline
crested.pl.region.bar(prediction, classes=output_names_biccn, xtick_rotation=90)
2026-02-16T14:49:39.462694+0100 INFO Lazily importing module crested.pl. This could take a second...
classes_of_interest = output_names_biccn[np.argmax(prediction)]
class_idx = np.argmax(prediction)

scores, one_hot_encoded_sequences = crested.tl.contribution_scores(
    sequence,
    target_idx=class_idx,
    model=model_biccn,
    batch_size=32,
)
2026-02-16T14:49:45.921519+0100 INFO Calculating contribution scores for 1 class(es) and 1 region(s).
%matplotlib inline
crested.pl.explain.contribution_scores(
    scores,
    one_hot_encoded_sequences,
    class_labels=classes_of_interest,
    zoom_n_bases=500,
    title="Example region",
)  # zoom in on the center 500bp

Same region with another model#
model_path, output_names_dmb3 = crested.get_model("DeepMouseBrain3")
model_dmb3 = crested.utils.load_model(model_path)
prediction = crested.tl.predict(sequence, model_dmb3)
1/1 ━━━━━━━━━━━━━━━━━━━━ 1s 1s/step
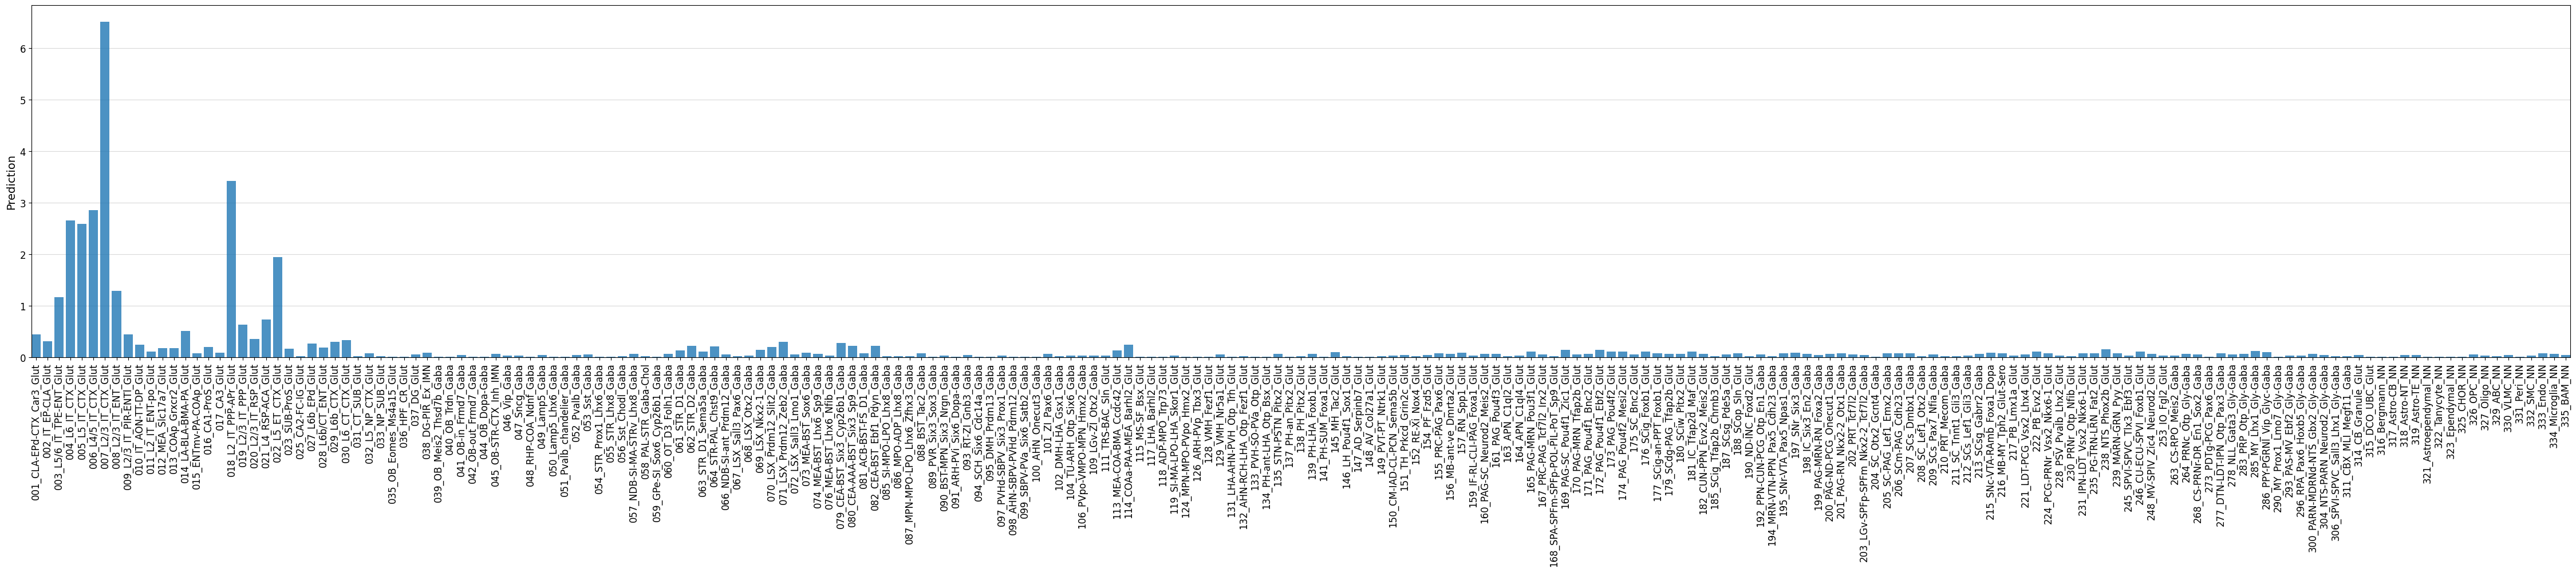
fig, ax = crested.pl.region.bar(prediction, classes=output_names_dmb3, xtick_rotation=90, width=45, height=10, show=False)
ax.margins(x=0)
classes_of_interest = output_names_dmb3[np.argmax(prediction)]
class_idx = np.argmax(prediction)

scores, one_hot_encoded_sequences = crested.tl.contribution_scores(
    sequence,
    target_idx=class_idx,
    model=model_dmb3,
    batch_size=32,
)
2026-02-16T14:50:49.623296+0100 INFO Calculating contribution scores for 1 class(es) and 1 region(s).
%matplotlib inline
crested.pl.explain.contribution_scores(
    scores,
    one_hot_encoded_sequences,
    class_labels=classes_of_interest,
    zoom_n_bases=500,
    title="Example region",
)

Track predictions#
Note
If you get an TypeError: <class 'something' could not be deserialized properly or TypeError: Could not locate class 'something'. Make sure custom classes are decorated with @keras.saving.register_keras_serializable() error, please try importing crested.tl.
If that still doesn’t fix things, add the required layers from crested.tl.zoo.utils as custom objects:
from crested.tl.zoo.utils._attention import MultiheadAttention

model = keras.models.load_model(
    model_path, custom_objects={"MultiheadAttention": MultiheadAttention}
)
import crested.tl
model_path, output_names_bp = crested.get_model("borzoiprime_mouse_rep0")
model_bp = crested.utils.load_model(model_path)
start_borzoi, end_borzoi = midpoint - 524288//2, midpoint + 524288//2
start_borzoi_output, end_borzoi_output = midpoint - 196608//2, midpoint + 196608//2
sequence_borzoi = genome.fetch(chrom, start_borzoi, end_borzoi)
prediction = crested.tl.predict(sequence_borzoi, model_bp)
1/1 ━━━━━━━━━━━━━━━━━━━━ 7s 7s/step
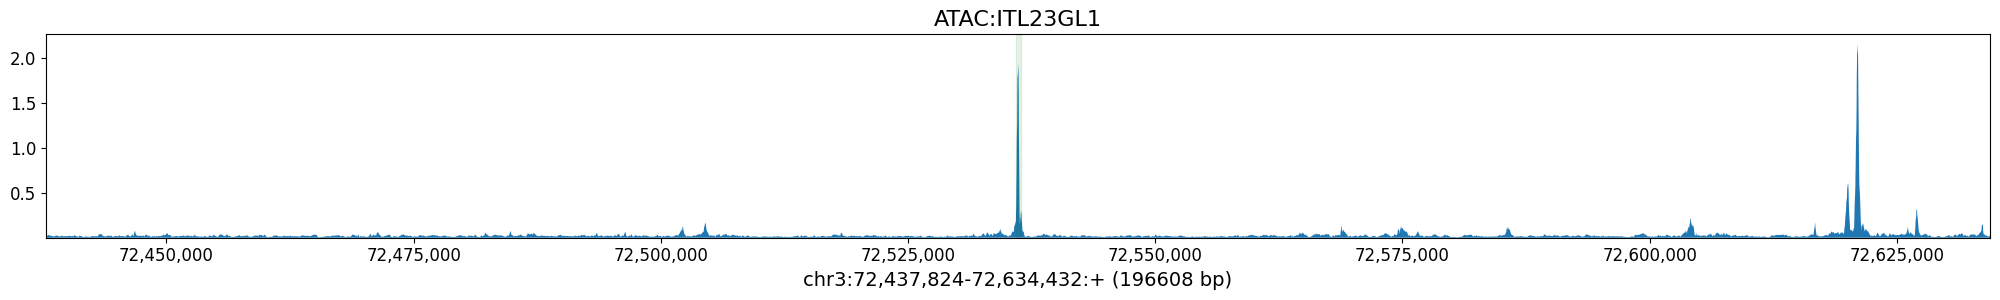
%matplotlib inline
class_idx = output_names_bp.index('ATAC:ITL23GL1') # Borzoi Prime Layer 2/3 neuron class

crested.pl.locus.track(
    prediction,
    class_idxs=class_idx,
    coordinates=(chrom, start_borzoi_output, end_borzoi_output),
    class_names=output_names_bp,
    highlight_positions=(start, end),
    show=False
)
plt.show()
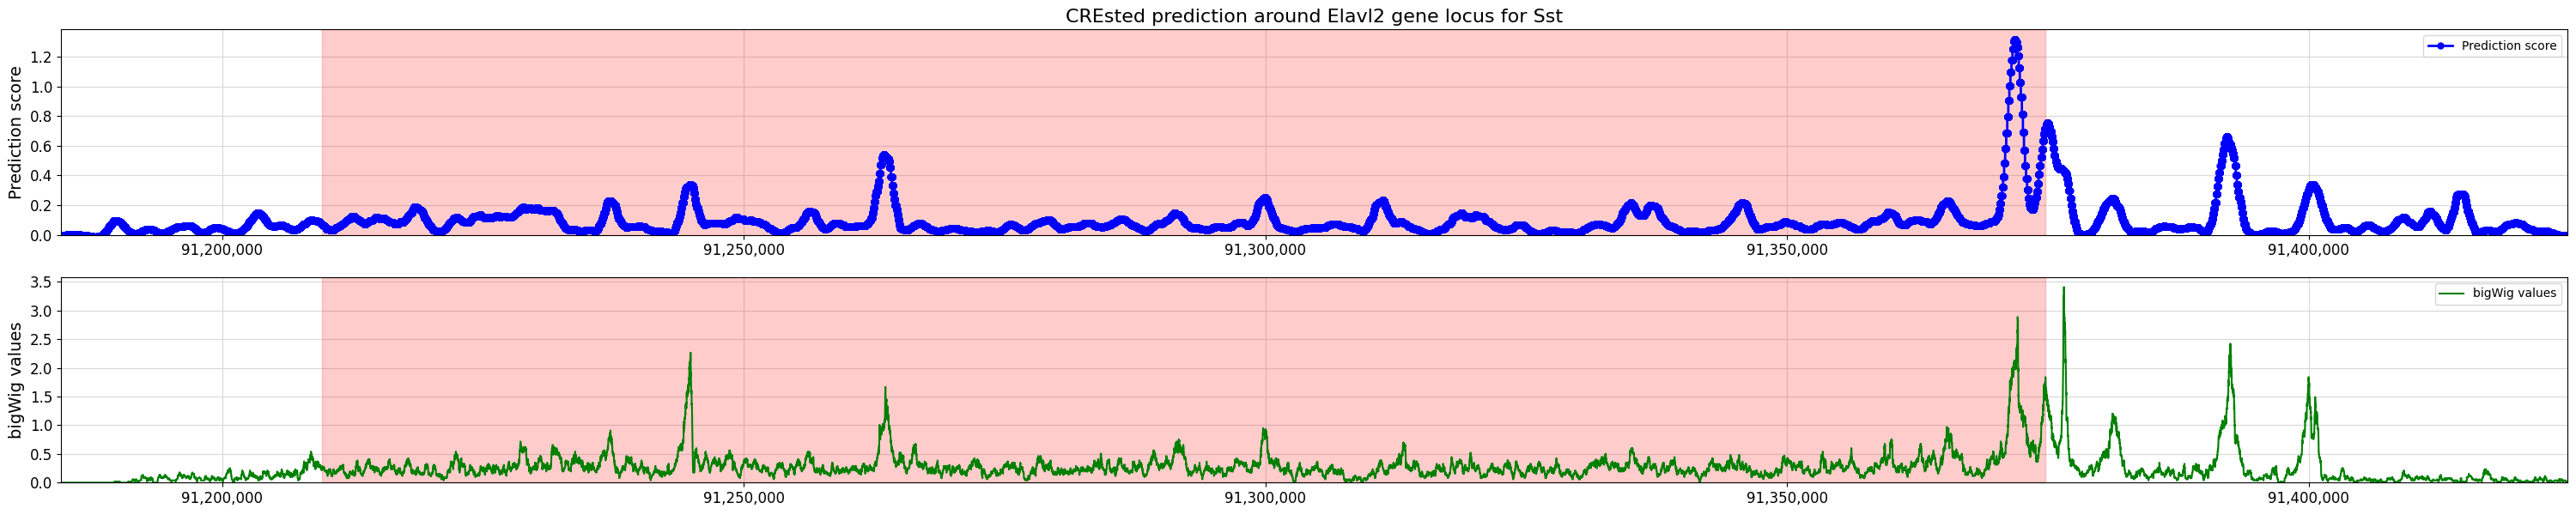
Gene locus predictions#
With BICCN model#
chrom = "chr4"
start = 91209533
end = 91374781

cell_type = "Sst"
class_idx = output_names_biccn.index(cell_type)

upstream = 50000
downstream = 25000

strand = "-"

scores, coordinates, min_loc, max_loc, tss_position = crested.tl.score_gene_locus(
    chr_name=chrom,
    gene_start=start,
    gene_end=end,
    target_idx=class_idx,
    model=model_biccn,
    strand=strand,
    upstream=upstream,
    downstream=downstream,
    step_size=100,
)
17/19 ━━━━━━━━━━━━━━━━━━━━ 0s 27ms/step
19/19 ━━━━━━━━━━━━━━━━━━━━ 9s 221ms/step
# Optional
bw_dir = Path("/staging/leuven/stg_00002/lcb/nkemp/mouse/biccn/bigwigs/bws/")
bw_path = bw_dir / f"{cell_type}.bw"

values = (
    crested.utils.read_bigwig_region(bw_path, (chrom, start - upstream, end + downstream))
    if strand == "+"
    else crested.utils.read_bigwig_region(bw_path, (chrom, start - downstream, end + upstream))
)
bw_values = values[0]
midpoints = values[1]
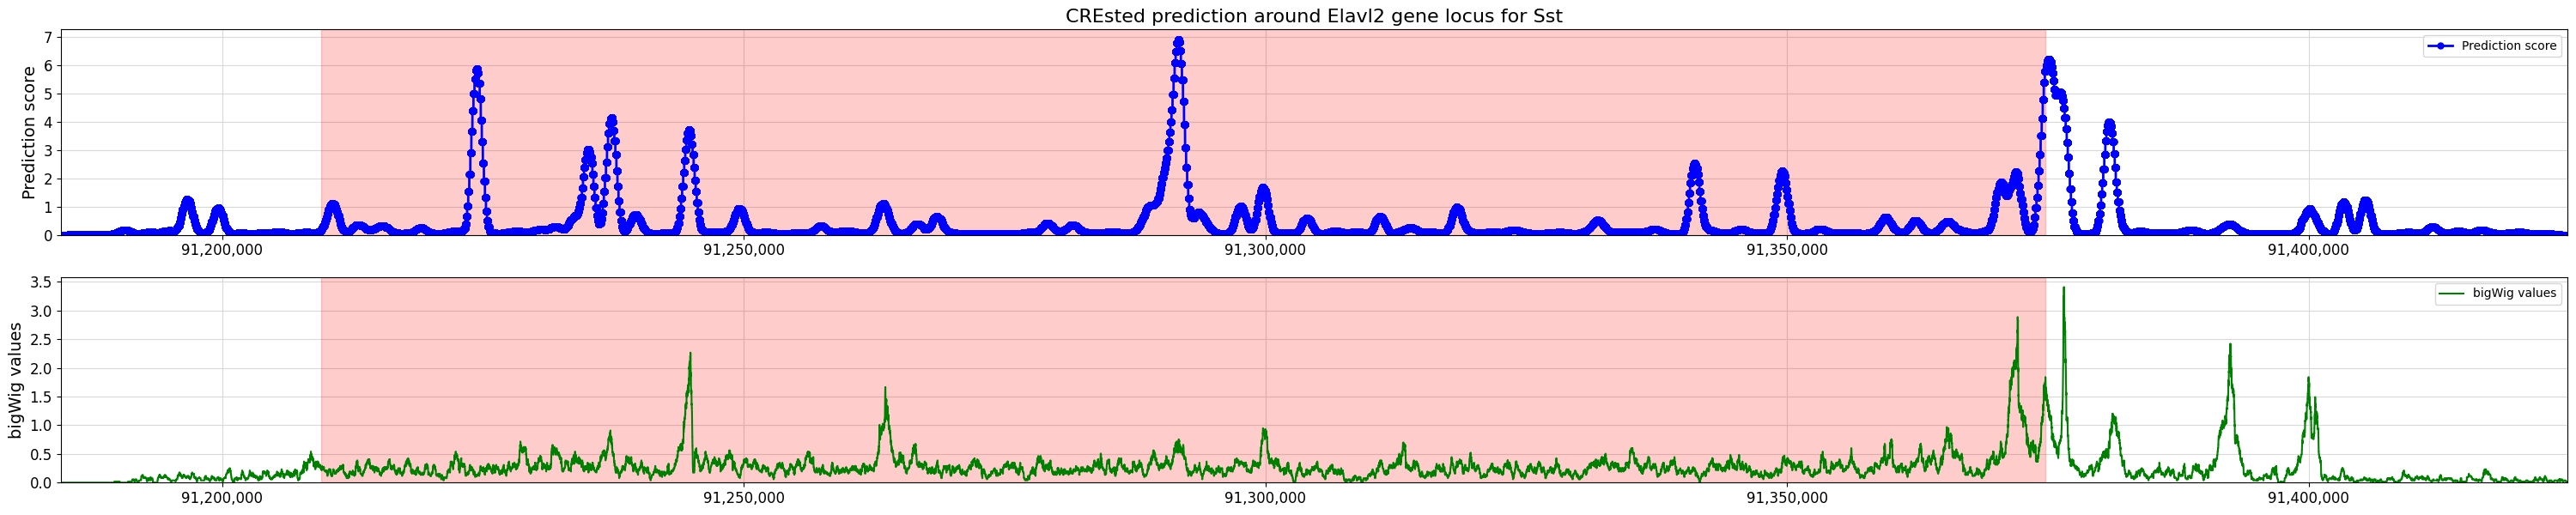
%matplotlib inline
crested.pl.locus.locus_scoring(
    scores,
    (min_loc, max_loc),
    gene_start=start,
    gene_end=end,
    title="CREsted prediction around Elavl2 gene locus for Sst",
    bigwig_values=bw_values,
    bigwig_midpoints=midpoints,
)
2026-02-16T14:54:46.854088+0100 WARNING Argument `title` only applying to the top plot is deprecated since version 2.0.0 to make behavior consistent. To keep a primary title, please use `suptitle='CREsted prediction around Elavl2 gene locus for Sst'` or `title=['CREsted prediction around Elavl2 gene locus for Sst', '']`.
With DeepMouseBrain3#
scores, coordinates, min_loc, max_loc, tss_position = crested.tl.score_gene_locus(
    chr_name=chrom,
    gene_start=start,
    gene_end=end,
    target_idx=class_idx,
    model=model_dmb3,
    strand=strand,
    upstream=upstream,
    downstream=downstream,
    step_size=100,
)
18/19 ━━━━━━━━━━━━━━━━━━━━ 0s 69ms/step
19/19 ━━━━━━━━━━━━━━━━━━━━ 20s 484ms/step
%matplotlib inline
crested.pl.locus.locus_scoring(
    scores,
    (min_loc, max_loc),
    gene_start=start,
    gene_end=end,
    title="CREsted prediction around Elavl2 gene locus for Sst",
    bigwig_values=bw_values,
    bigwig_midpoints=midpoints,
)
2026-02-16T14:55:08.018731+0100 WARNING Argument `title` only applying to the top plot is deprecated since version 2.0.0 to make behavior consistent. To keep a primary title, please use `suptitle='CREsted prediction around Elavl2 gene locus for Sst'` or `title=['CREsted prediction around Elavl2 gene locus for Sst', '']`.